For fiduciary investment advisors and wealth managers specializing in HOAs and community associations, standard reserve studies often lack the dynamic financial context needed to deliver compliant, high-yield investment strategies. To bridge this gap, we are introducing enhanced capital planning features designed specifically for the HOA investment advisor role.

The walk-through below uses a real $2.45M demo portfolio laddered across Money Market, Treasury Bills, FDIC-insured Brokered CDs, Treasury Notes, and Agency Bonds. Every screenshot is taken from the live FJ Strategic Reserve Study platform.

Capture every reserve asset in one ledger

Holdings ledger with 8 laddered positions
The Holdings ledger captures every position with custodian, account number, type, start and end dates, balance, and liquidity %.

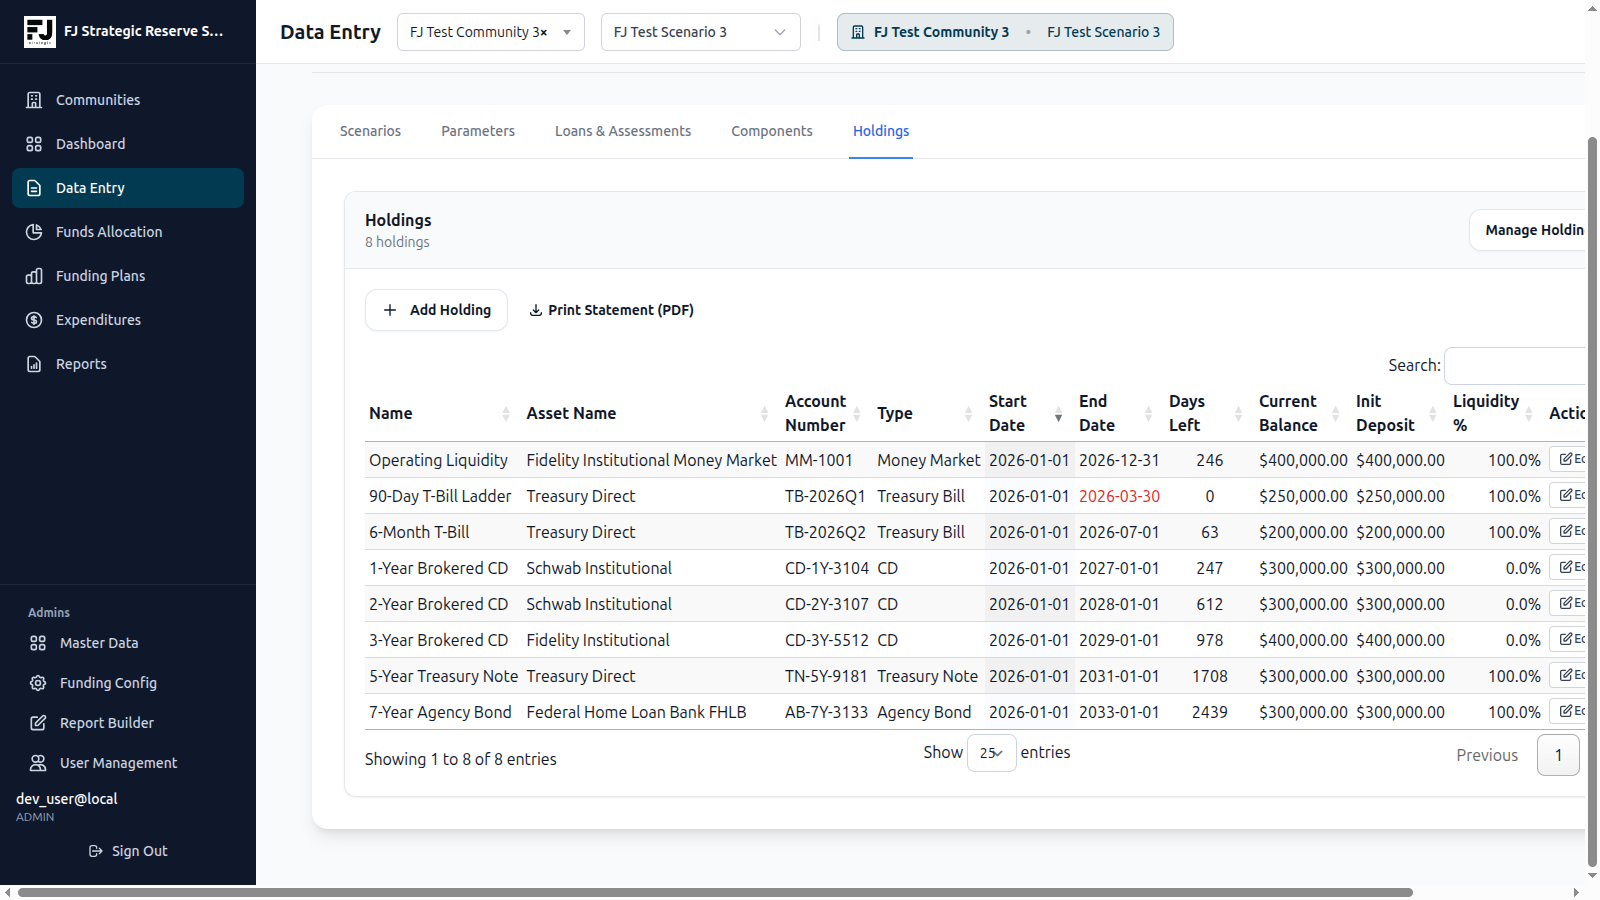
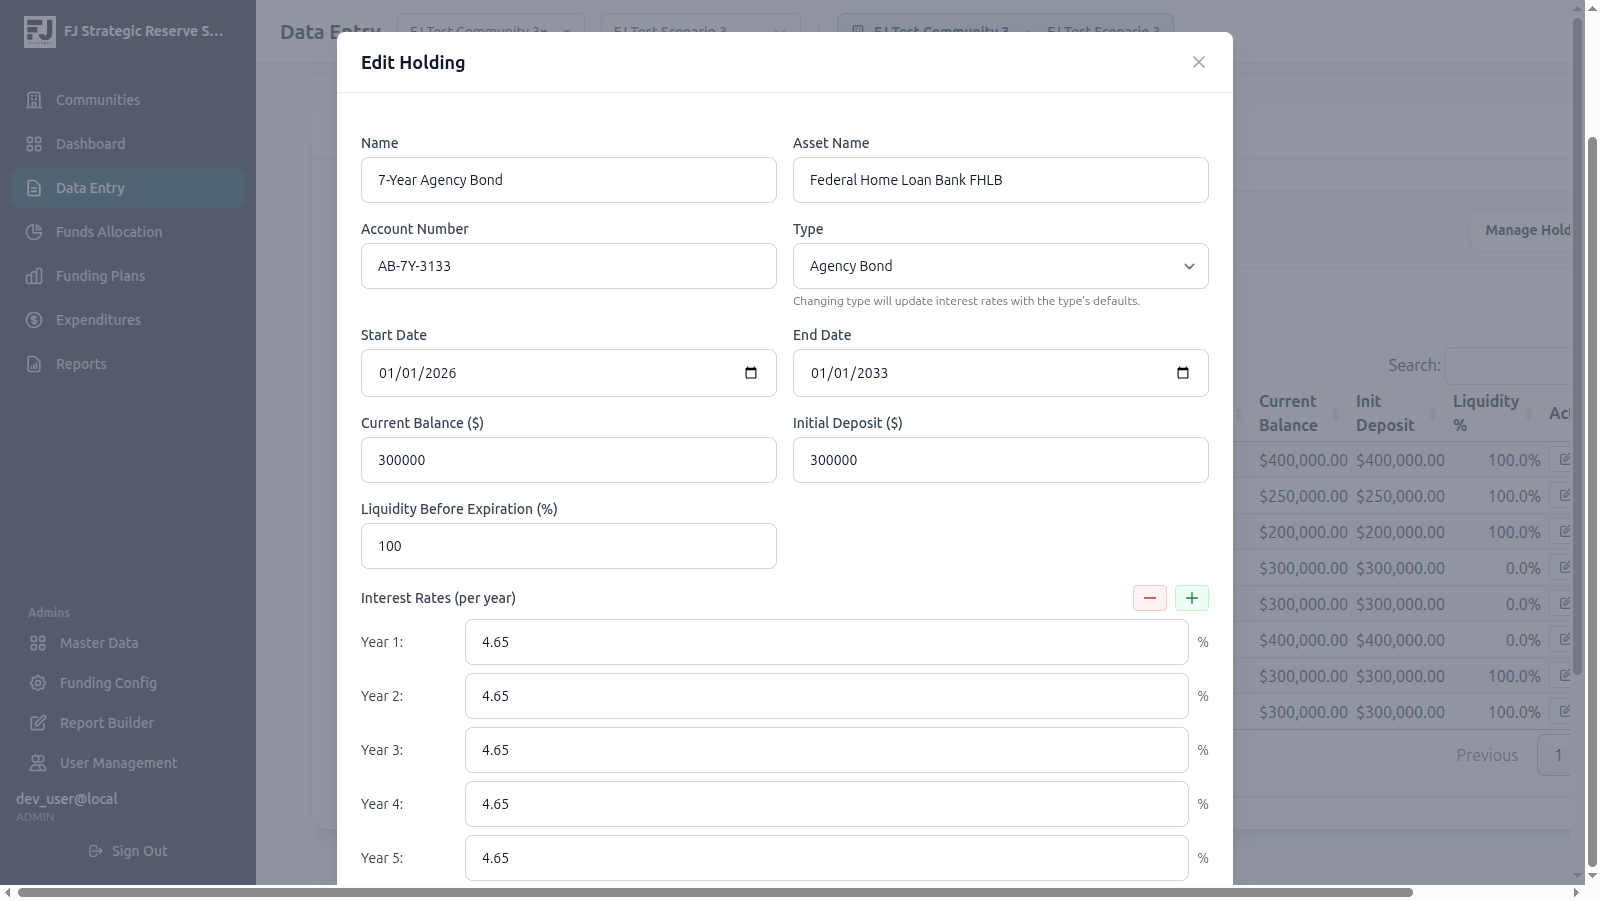
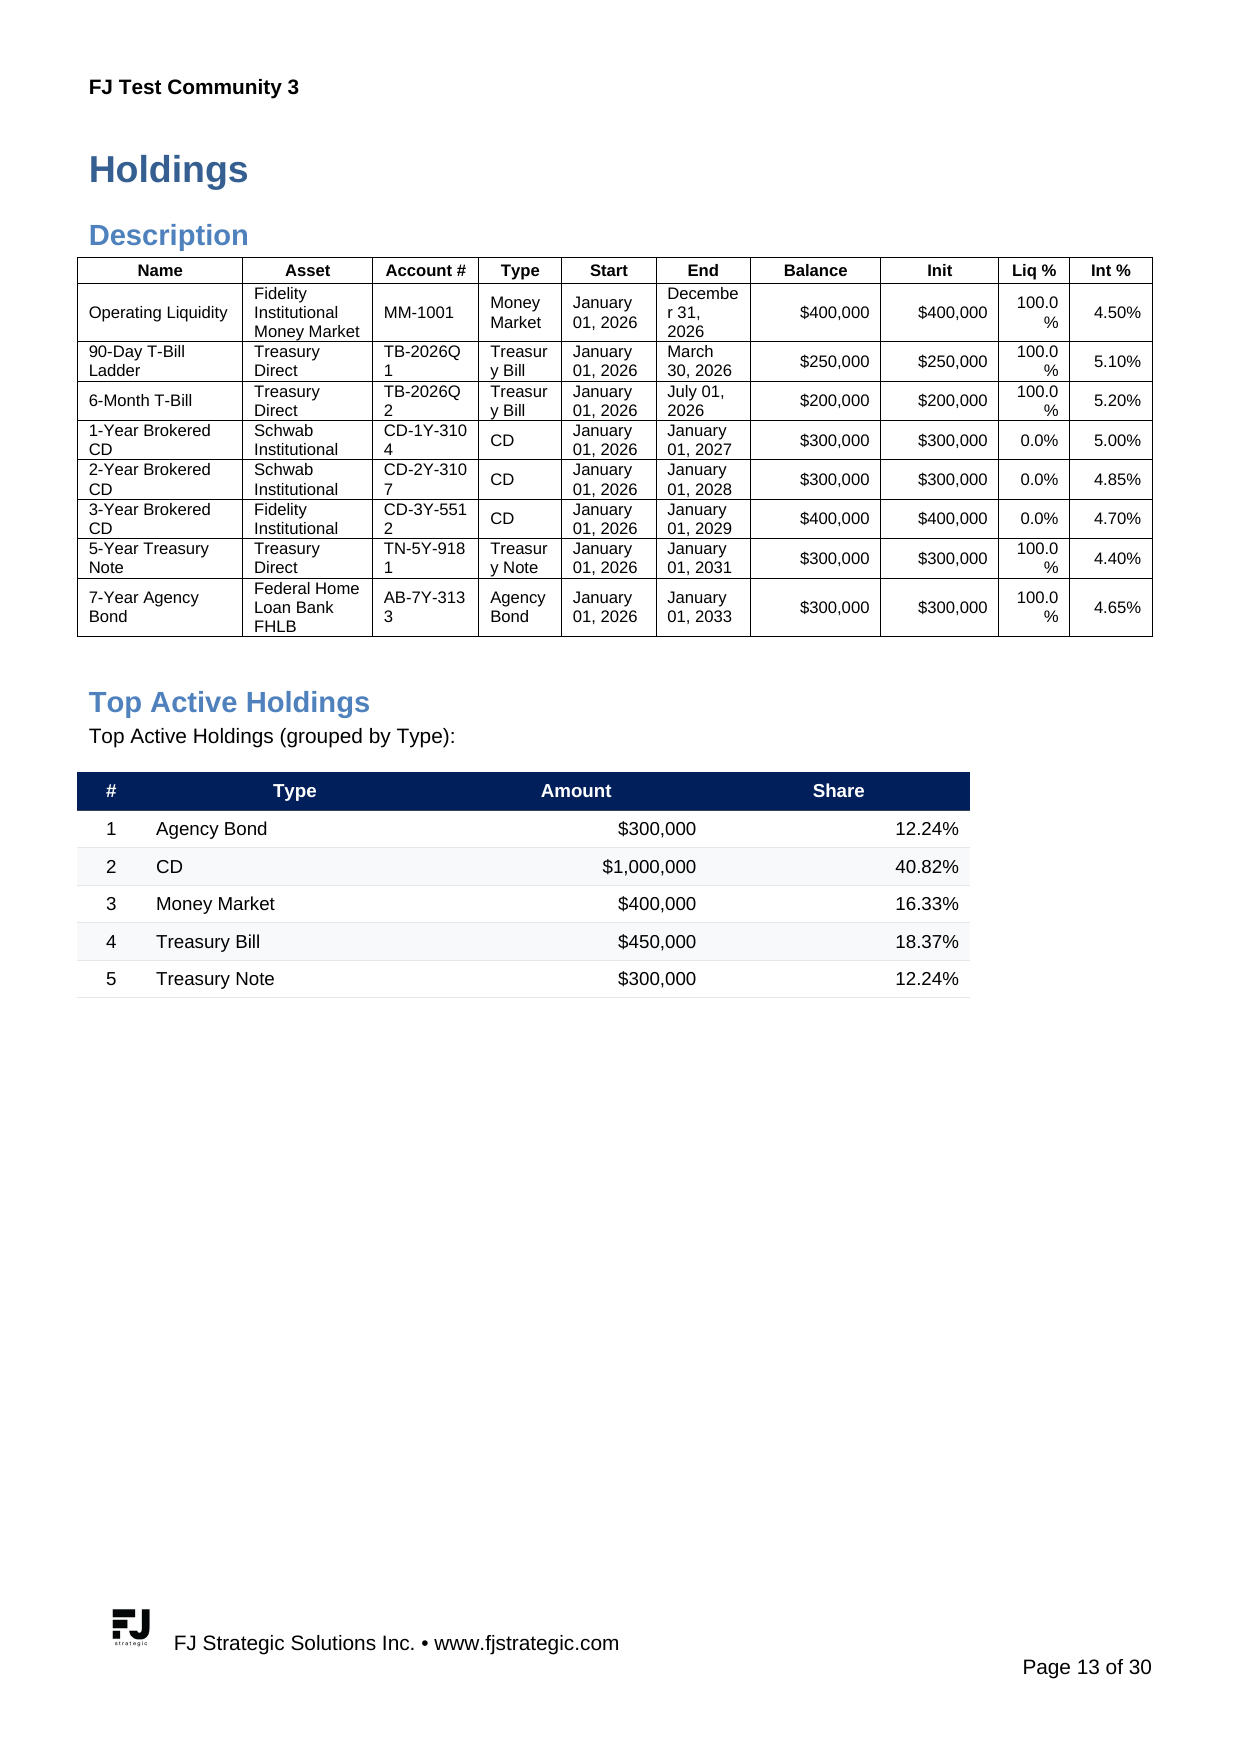
Investment advisors can mirror their custodial accounts (Schwab Institutional, Fidelity Institutional, Treasury Direct, etc.) inside the platform. Each holding stores the per-year interest rate so multi-year instruments like a 7-year FHLB Agency Bond at 4.65% are modeled accurately.

Holding entry modal showing 7-year Agency Bond at 4.65% per year
Per-year interest rate entry for a 7-Year FHLB Agency Bond, the platform supports yield-curve variability across the full term.

Govern your investment policy with custom holding types

Manage Holding Types modal with capitalization frequency
Approved asset classes with capitalization frequency and default rates, the foundation for a Davis-Stirling-compliant investment policy.

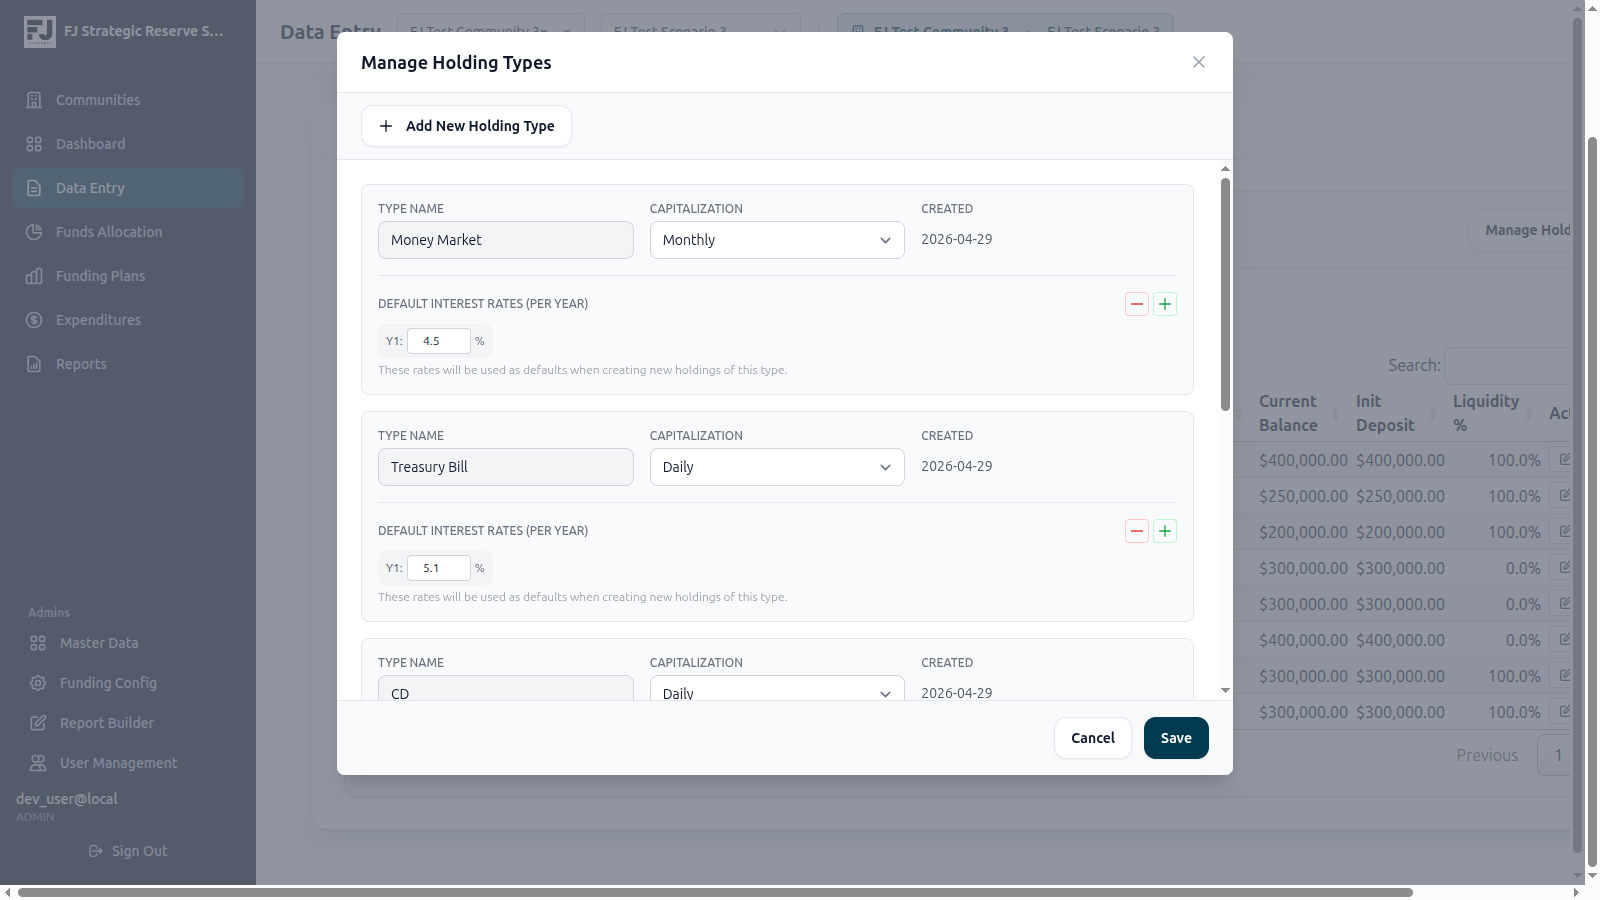
Centralizing approved asset classes (Money Market, Treasury Bill, CD, Treasury Note, Agency Bond) ensures every advisor enters holdings consistently and within the limits of the association’s investment policy. Capitalization frequency drives the interest accrual model.

Slice the portfolio four ways from the dashboard

Top Holdings By Type with 5-slice pie chart
By Type, instantly shows asset-class concentration and where to rebalance for safety, liquidity, or yield.
Top Holdings By Name and Account #
By Name & Account #, drills into each instrument with custodian and exact expiration date for board-level transparency.
Top Holdings By Expiration Year showing the maturity ladder
By Expiration Year, the maturity ladder visualized: $850K rolling in 2026 then $300K-$400K stepping out through 2033.

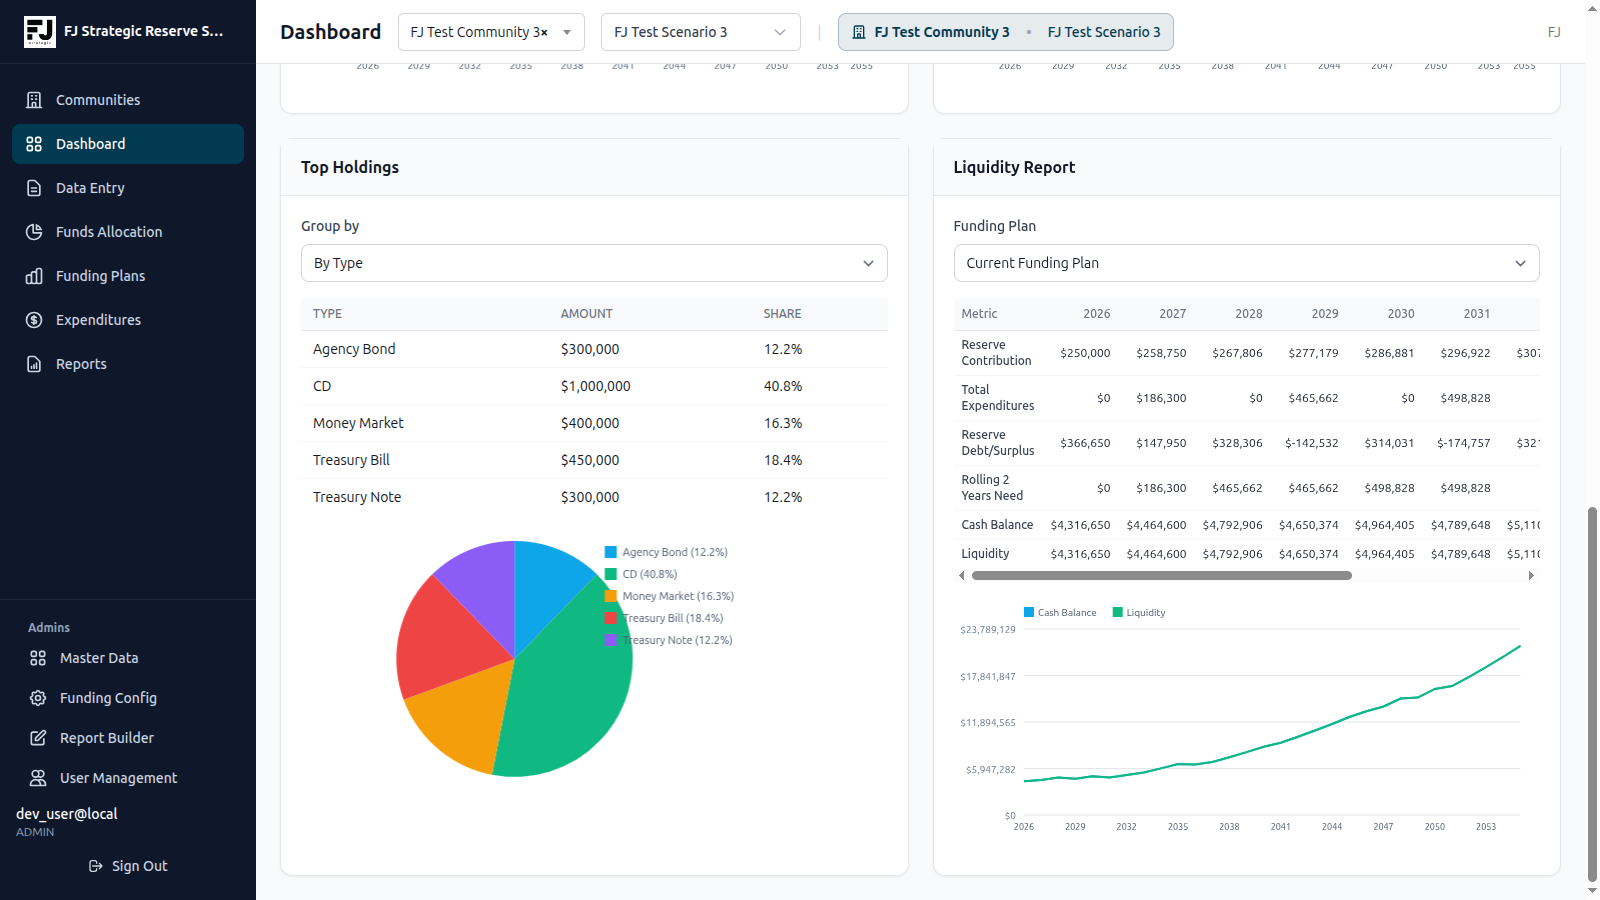
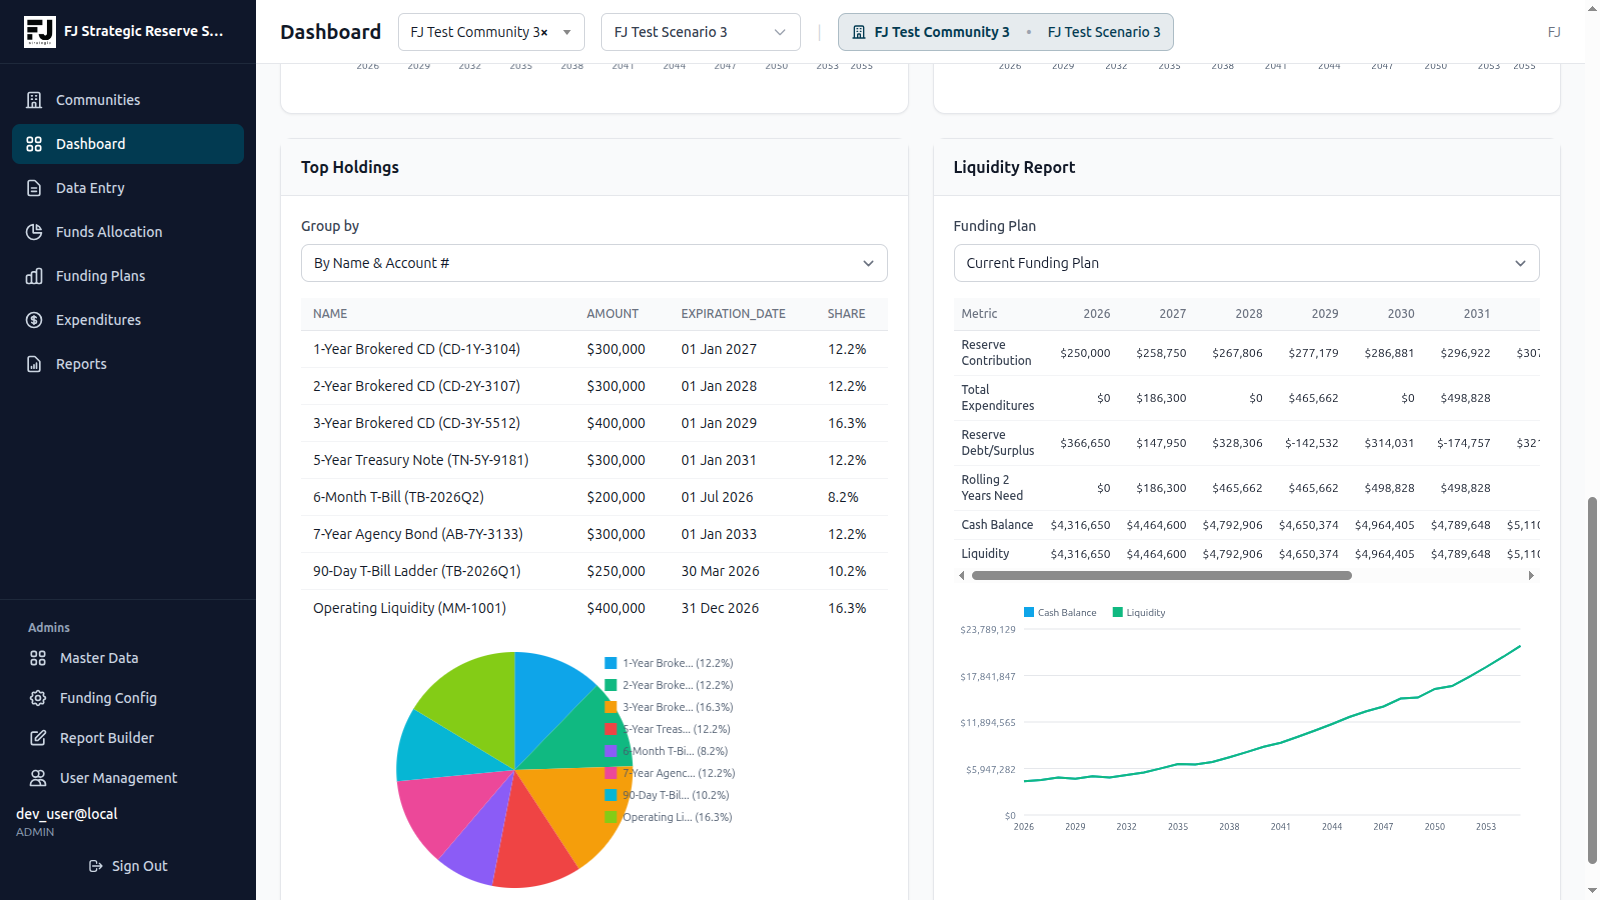
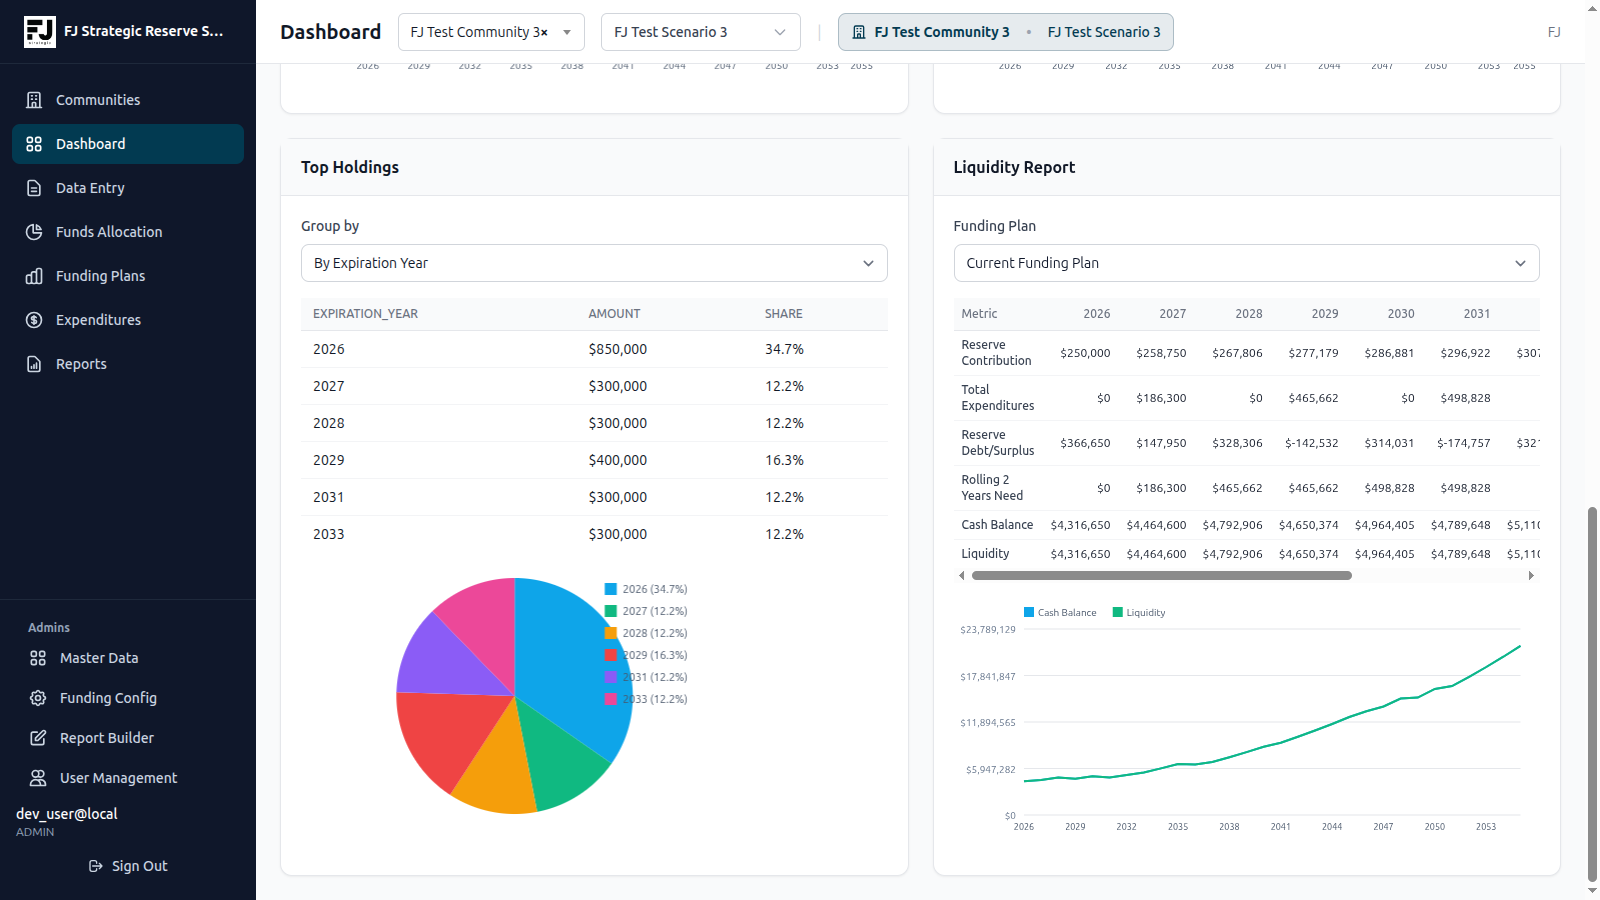
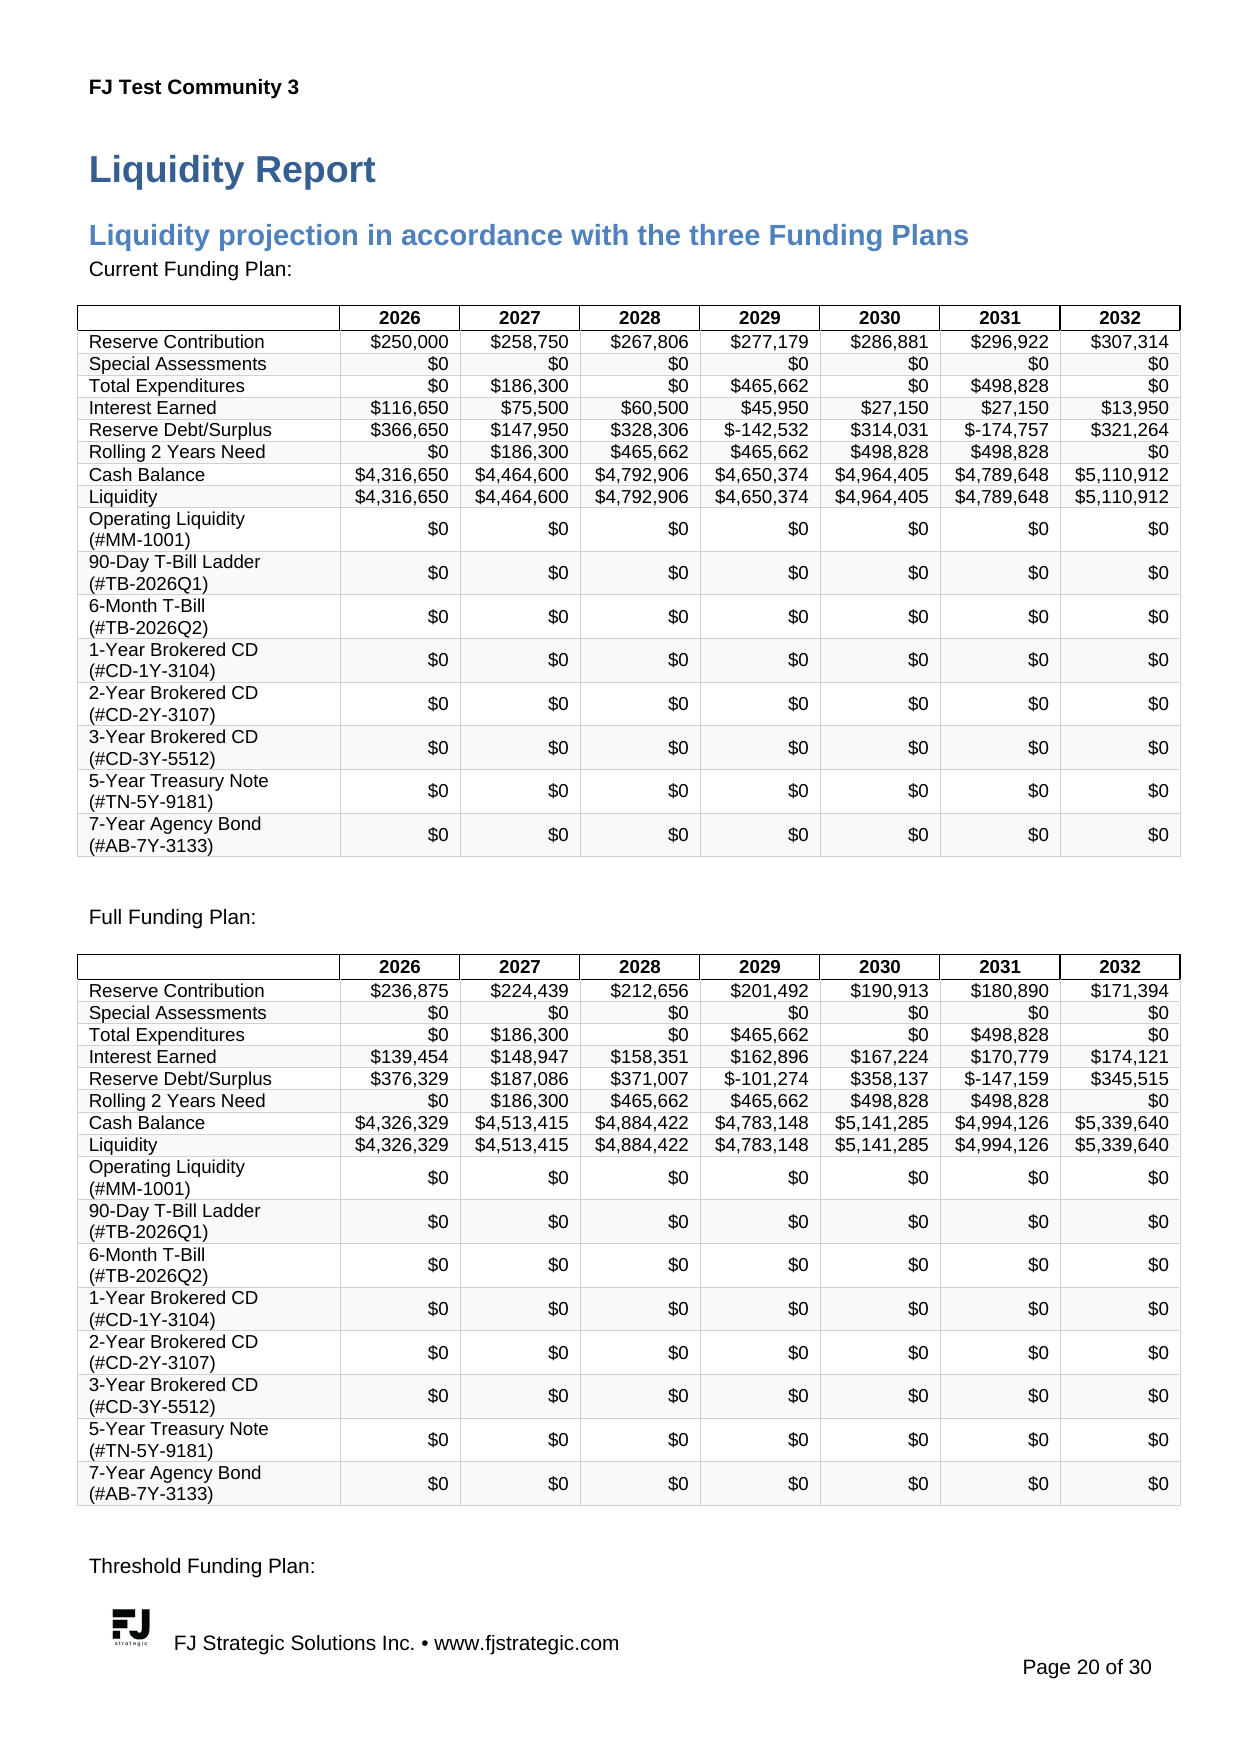
Connect holdings to a 7-year liquidity projection

Dashboard Top Holdings and Liquidity Report side-by-side
Holdings allocation and the 30-year liquidity curve in a single view, with rolling two-year need flagging when reinvestment is required.

The platform connects every holding to the scenario’s expenditure schedule. When a $180K roof recoat lands in 2027 and a $420K paving project hits in 2029, the rolling 2-year liquidity need updates automatically and the cash balance curve dips accordingly, so advisors know exactly which CDs need to mature first.

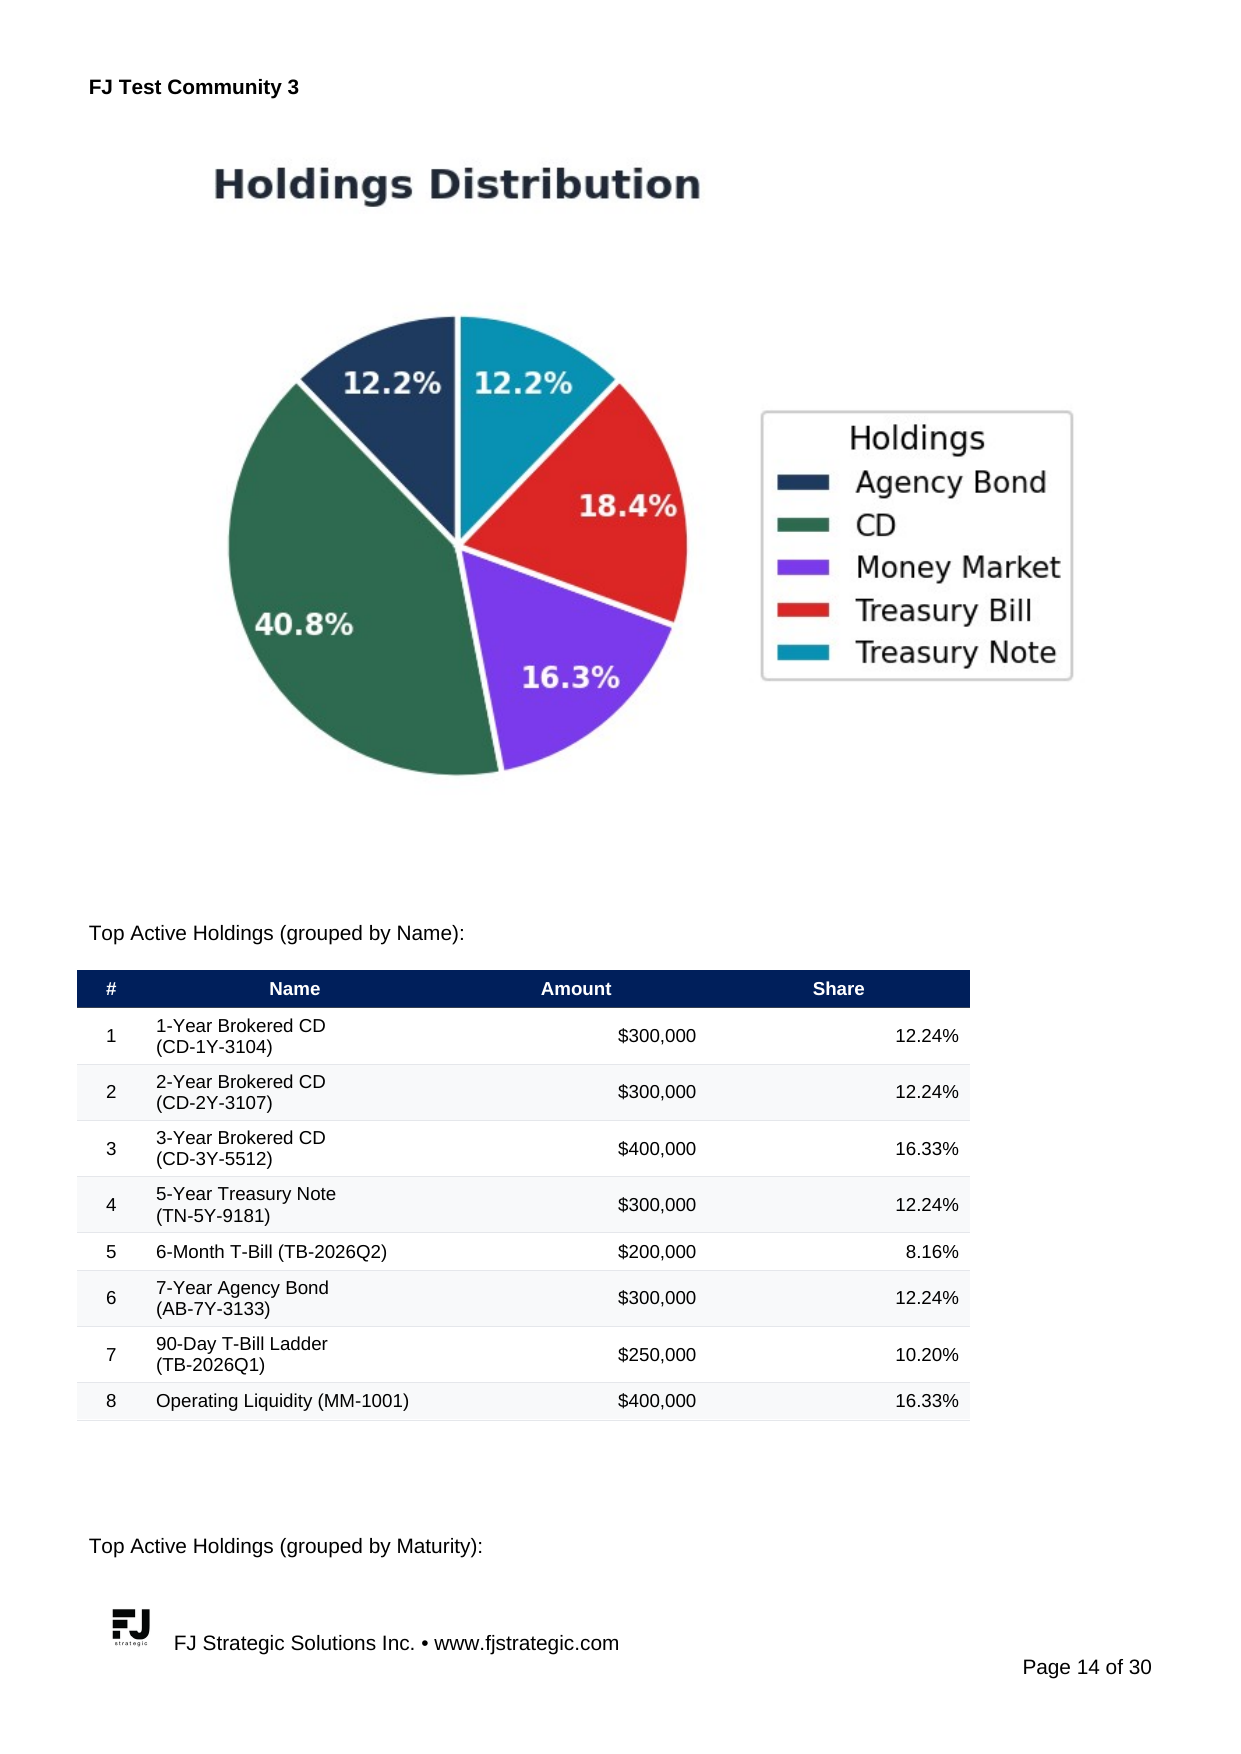
Deliver board-ready PDF reports

Holdings inventory page from the generated PDF
Page 13 of the generated reserve study PDF, full Holdings inventory with start/end dates, balances, liquidity %, and per-position interest rate.
Holdings Distribution chart in the PDF
The Holdings Distribution chart and grouped-by-name table go directly into the board packet.
7-year Liquidity Report across three Funding Plans
The 7-year Liquidity Report for all three Funding Plans (Current, Full, Threshold), Reserve Contribution, Total Expenditures, Interest Earned, Reserve Debt/Surplus, Rolling 2-Year Need, Cash Balance, and Liquidity, broken out by year.

Learn more about our purpose-built tools for HOA Investment Advisors and Capital Planning.

Join newsletter.

Get the latest updates for your Business.

Thank you for your message. It has been sent.
There was an error trying to send your message. Please try again later.

Continue Reading